


FY23
FY22
FY21
FY20
FY23
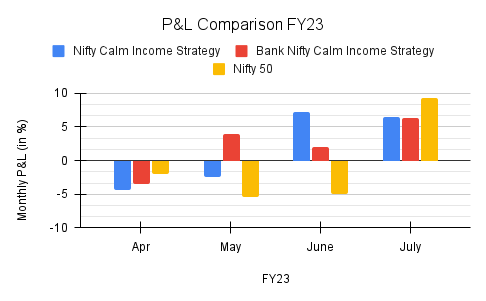
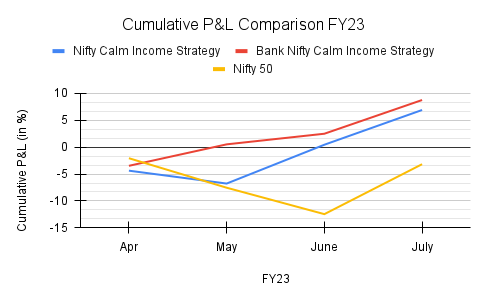
| Nifty Calm Income Strategy | Bank Nifty Calm Income Strategy | NIfty50 | ||||
| FY23 | Monthly P&L (in %) | Cumulative P&L (in %) | Monthly P&L (in %) | Cumulative P&L (in %) | Monthly P&L (in %) | Cumulative P&L (in %) |
| April | -4.38 | -4.38 | -3.48 | -3.48 | -2.07 | -2.07 |
| May | -2.39 | -6.77 | 3.98 | 0.5 | -5.47 | -7.54 |
| June | 7.2 | 0.43 | 1.97 | 2.47 | -4.09 | -12.44 |
| July | 5.23 | 5.66 | 6.25 | 8.72 | 9.26 | -3.18 |
| August | 6.87 | 12.53 | 4.63 | 13.35 | 2.89 | 0.29 |
FY22
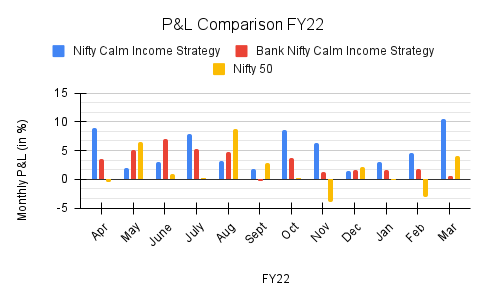
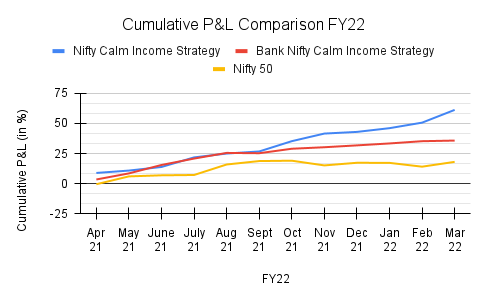
| Nifty Calm Income Strategy | Bank Nifty Calm Income Strategy | NIfty50 | ||||
| FY22 | Monthly P&L (in %) | Cumulative P&L (in %) | Monthly P&L (in %) | Cumulative P&L (in %) | Monthly P&L (in %) | Cumulative P&L (in %) |
| April | 8.93 | 8.93 | 3.52 | 3.52 | -0.41 | -0.41 |
| May | 1.97 | 10.9 | 5.04 | 8.56 | 6.5 | 6.09 |
| June | 2.98 | 13.88 | 6.97 | 15.53 | 0.89 | 6.98 |
| July | 7.92 | 21.8 | 5.3 | 20.83 | 0.26 | 7.24 |
| August | 3.19 | 24.99 | 4.68 | 25.51 | 8.69 | 15.93 |
| September | 1.73 | 26.72 | -0.25 | 25.26 | 2.84 | 18.77 |
| October | 8.51 | 35.23 | 3.7 | 28.96 | 0.3 | 19.07 |
| November | 6.29 | 41.52 | 1.25 | 30.21 | -3.9 | 15.17 |
| December | 1.38 | 42.9 | 1.54 | 31.75 | 2.18 | 17.35 |
| January | 3.09 | 45.99 | 1.6 | 33.35 | -0.08 | 17.27 |
| February | 4.57 | 50.56 | 1.86 | 35.21 | -3.15 | 14.12 |
| March | 10.55 | 61.11 | 0.51 | 35.72 | 3.99 | 18.11 |
FY21
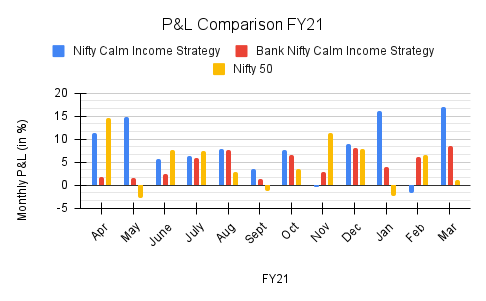
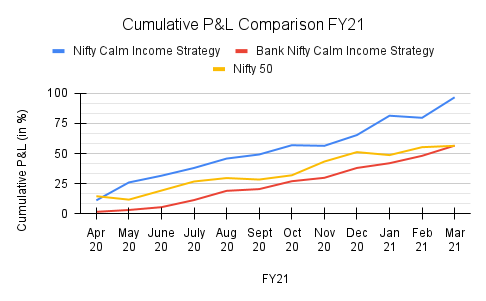
| Nifty Calm Income Strategy | Bank Nifty Calm Income Strategy | NIfty50 | ||||
| FY21 | Monthly P&L (in %) | Cumulative P&L (in %) | Monthly P&L (in %) | Cumulative P&L (in %) | Monthly P&L (in %) | Cumulative P&L (in %) |
| April | 11.24 | 11.24 | 1.74 | 1.74 | 14.68 | 14.68 |
| May | 14.84 | 26.08 | 1.53 | 3.27 | -2.84 | 11.84 |
| June | 5.57 | 31.65 | 2.34 | 5.61 | 7.53 | 19.37 |
| July | 6.41 | 38.06 | 5.88 | 11.49 | 7.49 | 26.86 |
| August | 7.77 | 45.83 | 7.64 | 19.13 | 2.84 | 29.7 |
| September | 3.38 | 49.21 | 1.42 | 20.55 | -1.23 | 28.47 |
| October | 7.66 | 56.87 | 6.53 | 27.08 | 3.51 | 31.98 |
| November | -0.49 | 56.38 | 2.83 | 29.91 | 11.39 | 43.37 |
| December | 8.91 | 65.29 | 8.16 | 38.07 | 7.81 | 51.18 |
| January | 16 | 81.29 | 3.91 | 41.98 | -2.48 | 48.7 |
| February | -1.72 | 79.57 | 6.12 | 48.1 | 6.56 | 55.26 |
| March | 16.96 | 96.53 | 8.45 | 56.55 | 1.11 | 56.37 |
FY20
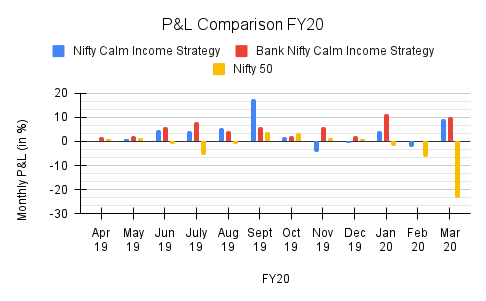
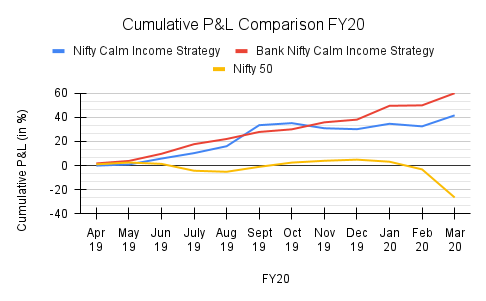
| Nifty Calm Income Strategy | Bank Nifty Calm Income Strategy | NIfty50 | ||||
| FY20 | Monthly P&L (in %); | Cumulative P&L (in %) | Monthly P&L (in %); | Cumulative P&L (in %) | Monthly P&L (in %); | Cumulative P&L (in %) |
| April | 0.01 | 0.01 | 1.81 | 1.81 | 1.07 | 1.07 |
| May | 0.95 | 0.96 | 2.05 | 3.86 | 1.49 | 2.56 |
| June | 4.88 | 5.84 | 5.93 | 9.79 | -1.12 | 1.44 |
| July | 4.5 | 10.34 | 7.96 | 17.75 | -5.69 | -4.25 |
| August | 5.72 | 16.06 | 4.29 | 22.04 | -0.85 | -5.1 |
| September | 17.42 | 33.48 | 5.81 | 27.85 | 4.09 | -1.01 |
| October | 1.68 | 35.16 | 2.18 | 30.03 | 3.51 | 2.5 |
| November | -4.24 | 30.92 | 5.79 | 35.82 | 1.5 | 4 |
| December | -0.77 | 30.15 | 2.24 | 38.06 | 0.93 | 4.93 |
| January | 4.48 | 34.63 | 11.44 | 49.5 | -1.7 | 3.23 |
| February | -2.13 | 32.5 | 0.37 | 49.87 | -6.36 | -3.13 |
| March | 9.1 | 41.6 | 10.05 | 59.92 | -23.25 | -26.38 |